Statistics Questions and Answers

Statistics
StatisticsA book claims that more hockey players are born in January through March than in October through December The following data show the number of players selected in a draft of new players for a hockey league according to their birth month Is there evidence to suggest that hockey players birthdates are not uniformly distributed throughout the year Use the level of significance 0 01 Click the icon to view the table Determine the null and alternative hypotheses Choose the correct answer below O A Ho The distribution of hockey players birth months is uniformly distributed H The distribution of hockey players birth months is not uniformly distributed OB Ho The distribution of hockey players birth months is uniformly distributed H More hockey players are born in the first half of the year than the second half OC Ho The distribution of hockey players birth months is uniformly distributed H More hockey players are born in January March than October December O D Ho The distribution of hockey players birth months is not uniformly distributed H The distribution of hockey players birth months is uniformly distributed Compute the expected counts for each birth month The total number of hockey players is 182 Round to two decimal places as needed Observed Count Expected Count Birth Month January March April June July September October December What is the test statistic 63 52 36 31 x Round to two decimal places as needed What is the P value of the test P value Round to three decimal places as needed Based on the results is the null hypothesis rejected Use the level of significance 0 01 OA No because the calculated P value is greater than the given a level of significance OB Yes because the calculated P value is less than the given a level of significance Oc Yes because the calculated P value is greater than the given a level of significance On No because the calculated P value is less than the given a level of significance

Statistics
StatisticsClayton Kershaw of the Los Angeles Dodgers is one of the premier pitchers in baseball His most popular pitch is K a four seam fastball The accompanying data represent the pitch speed in miles per hour for a random sample of 15 of his four seam fastball pitches Complete parts a through f Click here to view the data table Click here to view the standard normal distribution table page 1 Click here to view the standard normal distribution table page 2 Click here to view the table of critical t values Click here to view a table of critical values for the correlation coefficient a Is pitch speed a quantitative or qualitative variable Why is it important to know this when determining the type of confidence interval you may construct The variable pitch speed is a 10 qualitative data with b Draw a normal probability plot Then determine whether pitch speed could come from a population that is normally distributed by using the correlation coefficient of the normal probability plot 3 Which normal probability plot below represents the data OA O B 90 are constructed on quantitative data while confidence intervals for a A 100 Speed mph Q Q 95 100 Speed mph 90 variable This is important to know because confidence intervals for a Y are constructed on Speed mph Which boxplot below represents the data A B 90 that is normally distributed Round to three decimal places as needed c Draw a boxplot to verify the data set has no outliers 100 95 Speed mph Q 100 O C 3 O C 95 90 105 Speed mph Using the correlation coefficient of the normal probability plot is it reasonable to conclude that the population is normally distributed Since the absolute value of the correlation coefficient between the expected z scores and the ordered observed data reasonable to conclude that the data come from a population the critical value it 95 Q Q D 100 0 2 3 90 ma O D 90 100 Speed mph Q 95 5

Statistics
StatisticsThe acceptable level for insect filth in a certain food item is 3 insect fragments larvae eggs body parts and so on per 10 grams A simple random sample of 40 ten gram portions of the food item is obtained and results in a sample mean of x 3 2 insect fragments per ten gram portion Complete parts a through c below a Why is the sampling distribution of x approximately normal OA The sampling distribution of x is approximately normal because the population is normally distributed OB The sampling distribution of x is approximately normal because the population is normally distributed and the sample size is large enough OC The sampling distribution of x is assumed to be approximately normal O D The sampling distribution of x is approximately normal because the sample size is large enough b What is the mean and standard deviation of the sampling distribution of x assuming 3 and 3 HX Round to three decimal places as needed ox Round to three decimal places as needed c What is the probability a simple random sample of 40 ten gram portions of the food item results in a mean of at least 3 2 insect fragments P x2 3 2 Round to four decimal places as needed Is this result unusual OA This result is unusual because its probability is small OB This result is not unusual because its probability is large OC This result is unusual because its probability is large OD This result is not unusual because its probability is small What might we conclude OA Since this result is not unusual it is reasonable to conclude that the population mean is higher than 3 OB Since this result is not unusual it is not reasonable to conclude that the population mean is higher than 3 OC Since this result is unusual it is not reasonable to conclude that the population mean is higher than 3 OD Since this result is unusual it is reasonable to conclude that the population mean is higher than 3

Statistics
StatisticsAccording to flightstats com American Airlines flights from Dallas to Chicago are on time 80 of the time Suppose 25 flights are randomly selected and the number of on time flights is recorded a Explain why this is a binomial experiment b Determine the values of n and p c Find and interpret the probability that exactly 15 flights are on time d Find and interpret the probability that fewer than 15 flights are on time e Find and interpret the probability that at least 15 flights are on time f Find and interpret the probability that between 13 and 15 flights inclusive are on time SITE a Identify the statements that explain why this is a binomial experiment Select all that apply A The probability of success is different for each trial of the experiment B The experiment is performed until a desired number of successes are reached C The experiment is performed a fixed number of times D Each trial depends on the previous trial E There are three mutually exclusive possible outcomes arriving on time arriving early and arriving late F The probability of success is the same for each trial of the experiment G The trials are independent H There are two mutually exclusive outcomes success or failure b Using the binomial distribution determine the values of n and p Type an integer or a decimal Do not round Type an integer or a decimal Do not round n p c Using the binomial distribution the probability that exactly 15 flights are on time is Round to four decimal places as needed Interpret the probability In 100 trials of this experiment it is expected that about will result in exactly 15 flights being on time Round to the nearest whole number as needed d Using the binomial distribution the probability that fewer than 15 flights are on time is Round to four decimal places as needed Interpret the probability In 100 trials of this experiment it is expected that about will result in fewer than 15 flights being on time Round to the nearest whole number as needed e Using the binomial distribution the probability that at least 15 flights are on time is Round to four decimal places as needed Interpret the probability In 100 trials of this experiment it is expected that about will result in at least 15 flights being on time Round to the nearest whole number as needed f Using the binomial distribution the probability that between 13 and 15 flights inclusive are on time is Round to four decimal places as needed

Statistics
StatisticsIn a survey conducted by a reputable marketing agency 268 of 1000 adults 19 years of age bringing and using their cell phone every trip to the bathroom confessions included texting and answering phone calls Complete parts a through f below Click here to view the standard normal distribution table page 1 Click here to view the standard normal distribution table page 2 ACCES d Explain why the point estimate found in part c is a statistic Explain why it is a random variable What is the source of variability in the random variable Why is the point estimate found in part c a statistic OA Its value may change depending on the individuals in the survey OB It is information obtained from a survey OC It is being used to make inferences OD The sample size is large OE Its value is based on a sample Why is the point estimate found in part c a random variable OA The sample size is large OB Its value may change depending on the individuals in the survey OC It is information obtained from a survey OD Its value is based on a sample OE It is being used to make inferences What is the source of variability in the random variable OA The sample size OB Random errors OC The question asked in the survey OD The individuals selected to be in the study e Construct and interpret a 95 confidence interval for the population proportion of adults 19 years of age or older who bring their cell phone every trip to the bathroom Select the correct choice below and fill in any answer boxes within your choice Type integers or decimals rounded to three decimal places as needed Use ascending order OA There is a probability the proportion of adults 19 years of age or older who bring their cell phone every and trip to the bathroom is between OB We are confident the proportion of adults 19 years of age or older who bring their cell phone every trip and to the bathroom is between f What ensures that the results of this study are representative of all adults 19 years of age or older OA The large sample size from adults 19 years of age or older

Statistics
StatisticsSuppose that the efficacy of a certain drug is 0 64 Consider the sampling distribution sample size n 102 for the proportion of patients cured by this drug What is the mean of this distribution What is the standard deviation of this distribution Round answer to four decimal places

Statistics
Statistics38 Adding computerized medical images to a database promises to provide great resources for physicians However there are other methods of obtaining such information so the issue of efficiency of access needs to be investigated The article The Comparative Effectiveness of Conventional and Digital Image Libraries J of Audiovisual Media in Medicine 2001 8 15 reported on an experiment in which 13 computer proficient medical professionals were timed both while retrieving an image from a library of slides and while retrieving the same image from a computer database with a Web front end Subject Slide Digital Difference 1 2 3 30 35 40 25 16 15 5 19 25 Subject Slide Digital 8 9 10 62 40 51 16 15 13 Difference 46 25 4 25 15 10 11 25 11 38 14 5 828 2923 20 10 10 12 42 19 6 7 30 35 20 7 10 28 13 33 19 14 a Construct a comparative boxplot of times for the two types of retrieval and comment on any interesting features b Estimate the difference between true average times for the two types of retrieval in a way that conveys infor mation about precision and reliability Be sure to check the plausibility of any assumptions needed in your analysis Does it appear plausible that the true average times for the two types of retrieval are identical Why or why not 40 Refer to Exercise 38 What is B for the test when true average DNA content is identical for three of the diets and falls below this common value by 1 standard devia tion fad for
Statistics
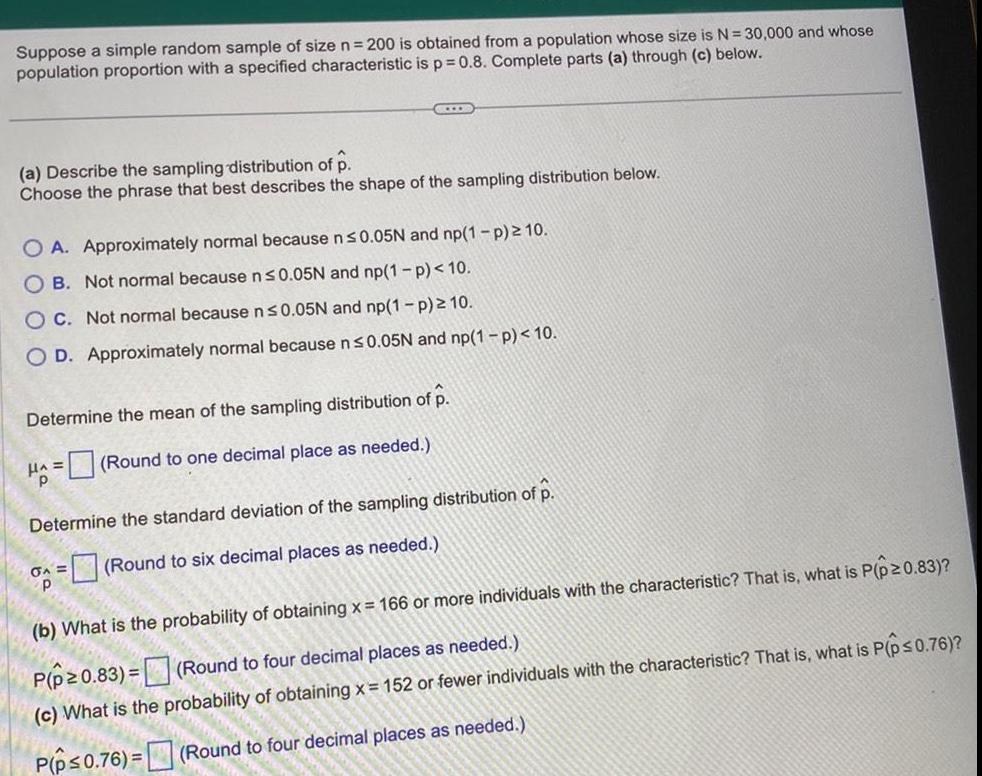
StatisticsSuppose a simple random sample of size n 200 is obtained from a population whose size is N 30 000 and whose population proportion with a specified characteristic is p 0 8 Complete parts a through c below L a Describe the sampling distribution of p Choose the phrase that best describes the shape of the sampling distribution below O A Approximately normal because n 0 05N and np 1 p 10 OB Not normal because n 0 05N and np 1 p 10 OC Not normal because n 0 05N and np 1 p 10 O D Approximately normal because n 0 05N and np 1 p 10 Determine the mean of the sampling distribution of p HA Round to one decimal place as needed Determine the standard deviation of the sampling distribution of p A Round to six decimal places as needed b What is the probability of obtaining x 166 or more individuals with the characteristic That is what is P p 0 83 P p 0 83 Round to four decimal places as needed c What is the probability of obtaining x 152 or fewer individuals with the characteristic That is what is P p 0 76 P p 0 76 Round to four decimal places as needed
Statistics
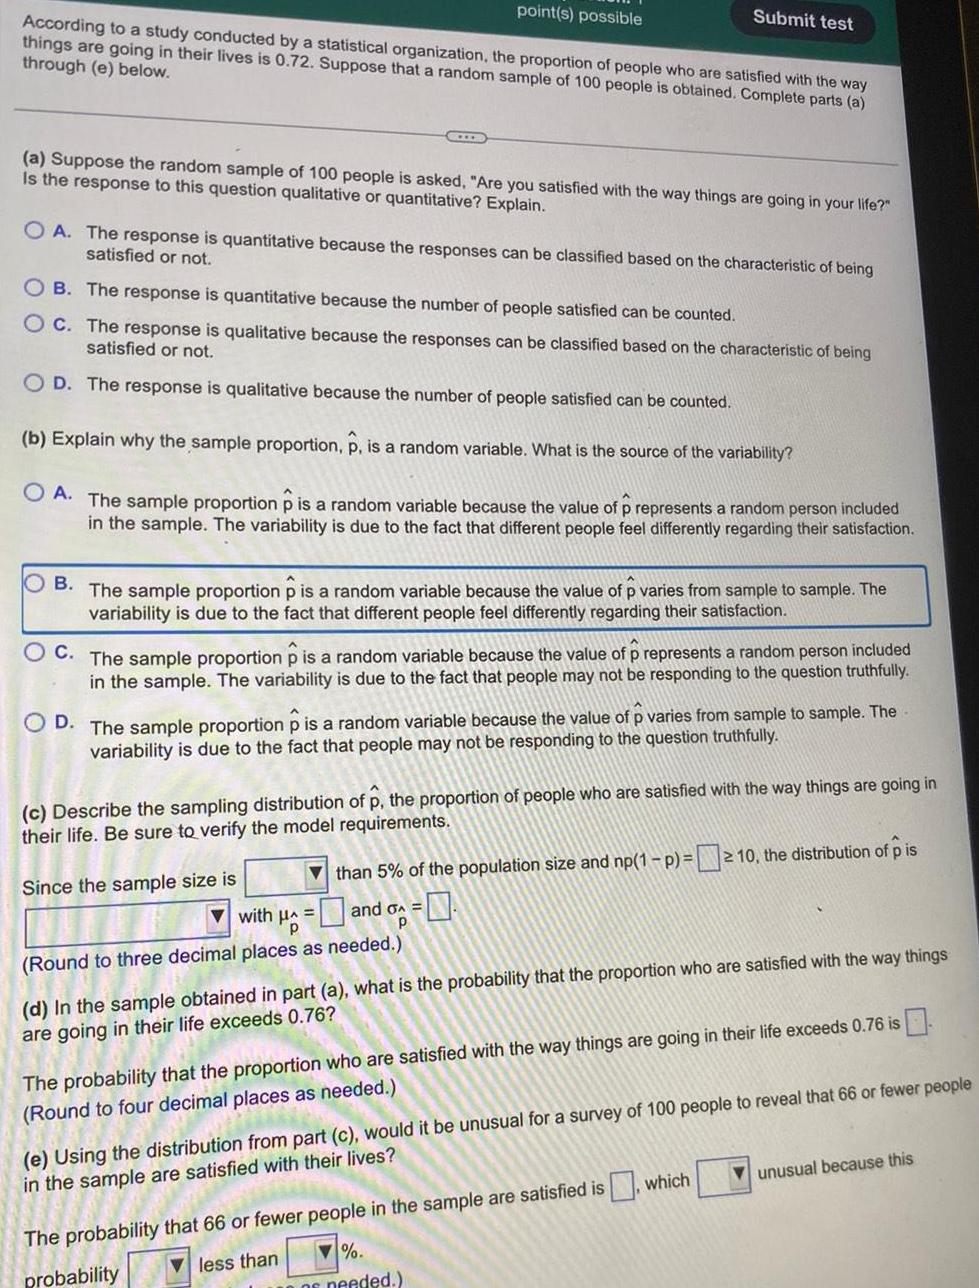
Statisticspoint s possible According to a study conducted by a statistical organization the proportion of people who are satisfied with the way things are going in their lives is 0 72 Suppose that a random sample of 100 people is obtained Complete parts a through e below a Suppose the random sample of 100 people is asked Are you satisfied with the way things are going in your life Is the response to this question qualitative or quantitative Explain Submit test OA The response is quantitative because the responses can be classified based on the characteristic of being satisfied or not OB The response is quantitative because the number of people satisfied can be counted OC The response is qualitative because the responses can be classified based on the characteristic of being satisfied or not OD The response is qualitative because the number of people satisfied can be counted b Explain why the sample proportion p is a random variable What is the source of the variability OA The sample proportion p is a random variable because the value of p represents a random person included in the sample The variability is due to the fact that different people feel differently regarding their satisfaction OB The sample proportion p is a random variable because the value of p varies from sample to sample The variability is due to the fact that different people feel differently regarding their satisfaction C The sample proportion p is a random variable because the value of p represents a random person included in the sample The variability is due to the fact that people may not be responding to the question truthfully OD The sample proportion p is a random variable because the value of p varies from sample to sample The variability is due to the fact that people may not be responding to the question truthfully c Describe the sampling distribution of p the proportion of people who are satisfied with the way things are going in their life Be sure to verify the model requirements 2 than 5 of the population size and np 1 p 10 the distribution of p is with A and G p Round to three decimal places as needed Since the sample size is d In the sample obtained in part a what is the probability that the proportion who are satisfied with the way things are going in their life exceeds 0 76 The probability that the proportion who are satisfied with the way things are going in their life exceeds 0 76 is Round to four decimal places as needed e Using the distribution from part c would it be unusual for a survey of 100 people to reveal that 66 or fewer people in the sample are satisfied with their lives The probability that 66 or fewer people in the sample are satisfied is which less than probability of needed unusual because this
Statistics
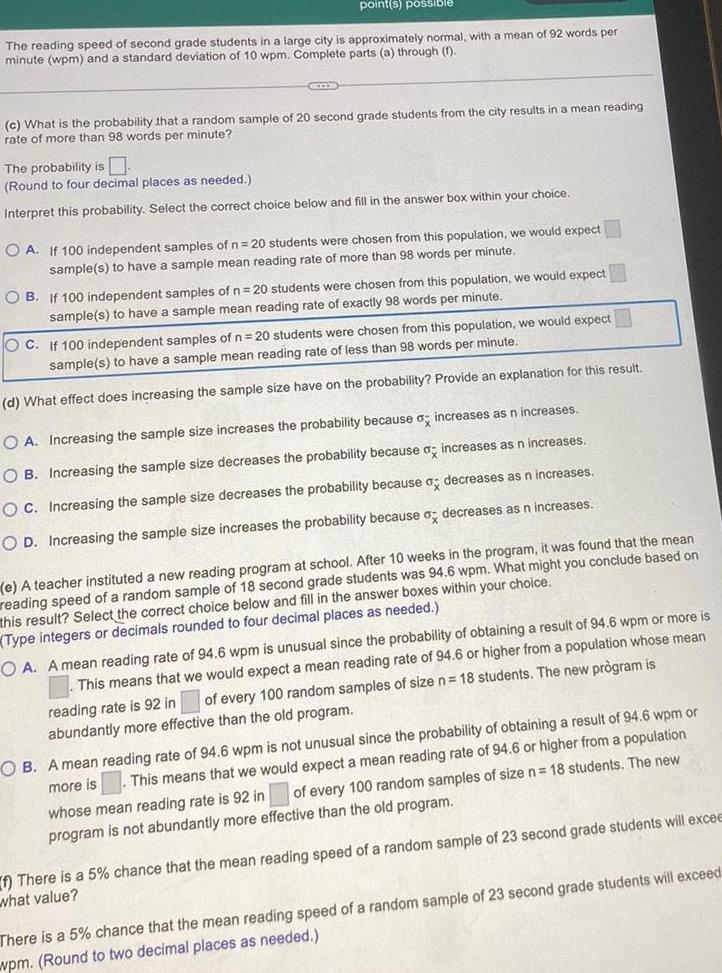
Statisticspoint s possible The reading speed of second grade students in a large city is approximately normal with a mean of 92 words per minute wpm and a standard deviation of 10 wpm Complete parts a through 1 c What is the probability that a random sample of 20 second grade students from the city results in a mean reading rate of more than 98 words per minute The probability is Round to four decimal places as needed Interpret this probability Select the correct choice below and fill in the answer box within your choice OA If 100 independent samples of n 20 students were chosen from this population we would expect sample s to have a sample mean reading rate of more than 98 words per minute OB If 100 independent samples of n 20 students were chosen from this population we would expect sample s to have a sample mean reading rate of exactly 98 words per minute OC If 100 independent samples of n 20 students were chosen from this population we would expect sample s to have a sample mean reading rate of less than 98 words per minute d What effect does increasing the sample size have on the probability Provide an explanation for this result OA Increasing the sample size increases the probability because o increases as n increases OB Increasing the sample size decreases the probability because o increases as n increases OC Increasing the sample size decreases the probability because a decreases as n increases OD Increasing the sample size increases the probability because o decreases as n increases e A teacher instituted a new reading program at school After 10 weeks in the program it was found that the mean reading speed of a random sample of 18 second grade students was 94 6 wpm What might you conclude based on this result Select the correct choice below and fill in the answer boxes within your choice Type integers or decimals rounded to four decimal places as needed OA A mean reading rate of 94 6 wpm is unusual since the probability of obtaining a result of 94 6 wpm or more is This means that we would expect a mean reading rate of 94 6 or higher from a population whose mean of every 100 random samples of size n 18 students The new pr gram is reading rate is 92 in abundantly more effective than the old program OB A mean reading rate of 94 6 wpm is not unusual since the probability of obtaining a result of 94 6 wpm or more is This means that we would expect a mean reading rate of 94 6 or higher from a population of every 100 random samples of size n 18 students The new whose mean reading rate is 92 in program is not abundantly more effective than the old program f There is a 5 chance that the mean reading speed of a random sample of 23 second grade students will excee what value There is a 5 chance that the mean reading speed of a random sample of 23 second grade students will exceed wpm Round to two decimal places as needed
Statistics
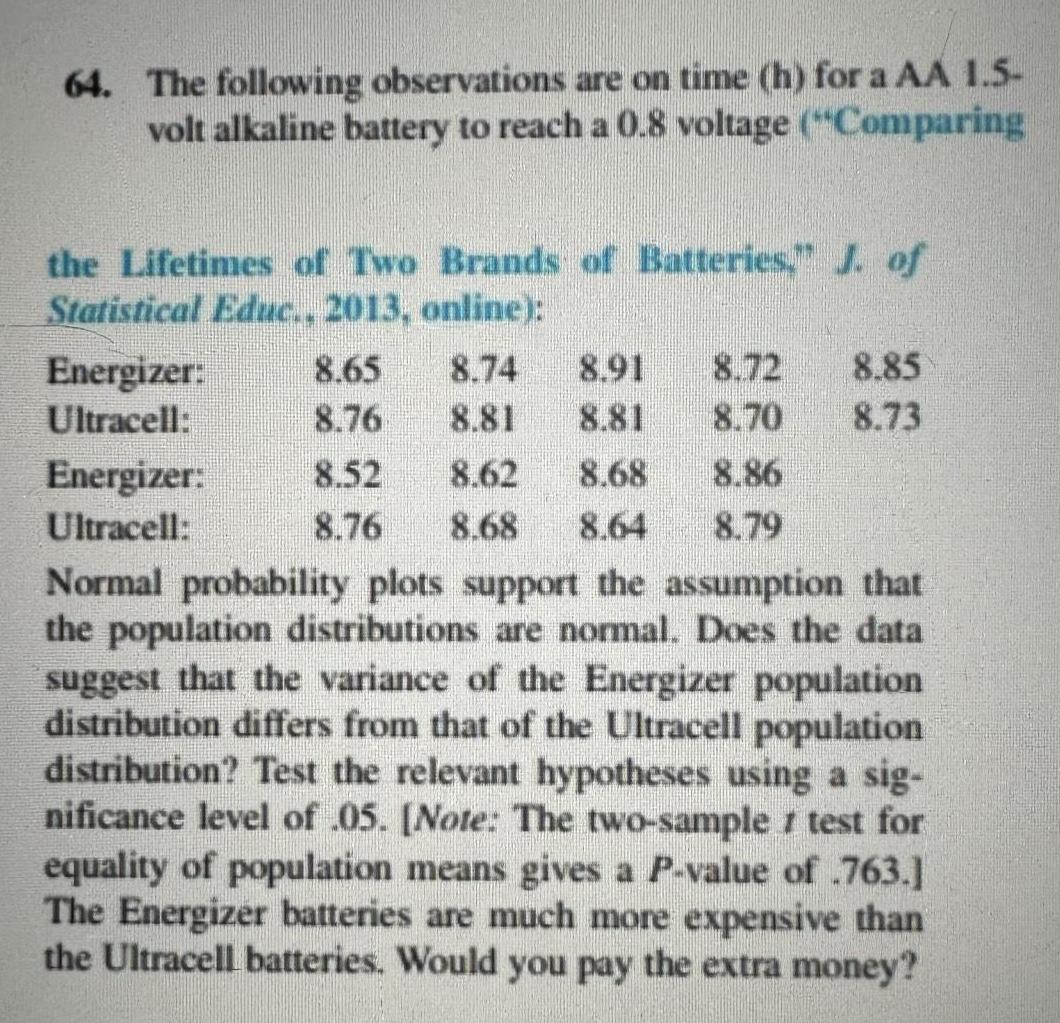
Statistics64 The following observations are on time h for a AA 1 5 volt alkaline battery to reach a 0 8 voltage Comparing the Lifetimes of Two Brands of Batteries J of Statistical Educ 2013 online Energizer Ultracell 8 65 8 74 8 91 8 76 8 81 8 52 8 62 8 68 8 76 8 68 8 64 Normal probability plots support the assumption that the population distributions are normal Does the data suggest that the variance of the Energizer population distribution differs from that of the Ultracell population distribution Test the relevant hypotheses using a sig nificance level of 05 Note The two sample test for equality of population means gives a P value of 763 The Energizer batteries are much more expensive than the Ultracell batteries Would you pay the extra money Energizer Ultracell 8 85 8 73 8 70 8 86 8 79
Statistics
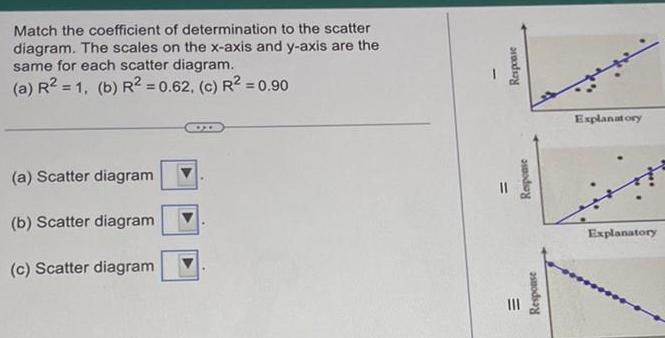
StatisticsMatch the coefficient of determination to the scatter diagram The scales on the x axis and y axis are the same for each scatter diagram a R 1 b R2 0 62 c R 0 90 a Scatter diagram b Scatter diagram c Scatter diagram Response Response Response Explanatory Explanatory
Statistics
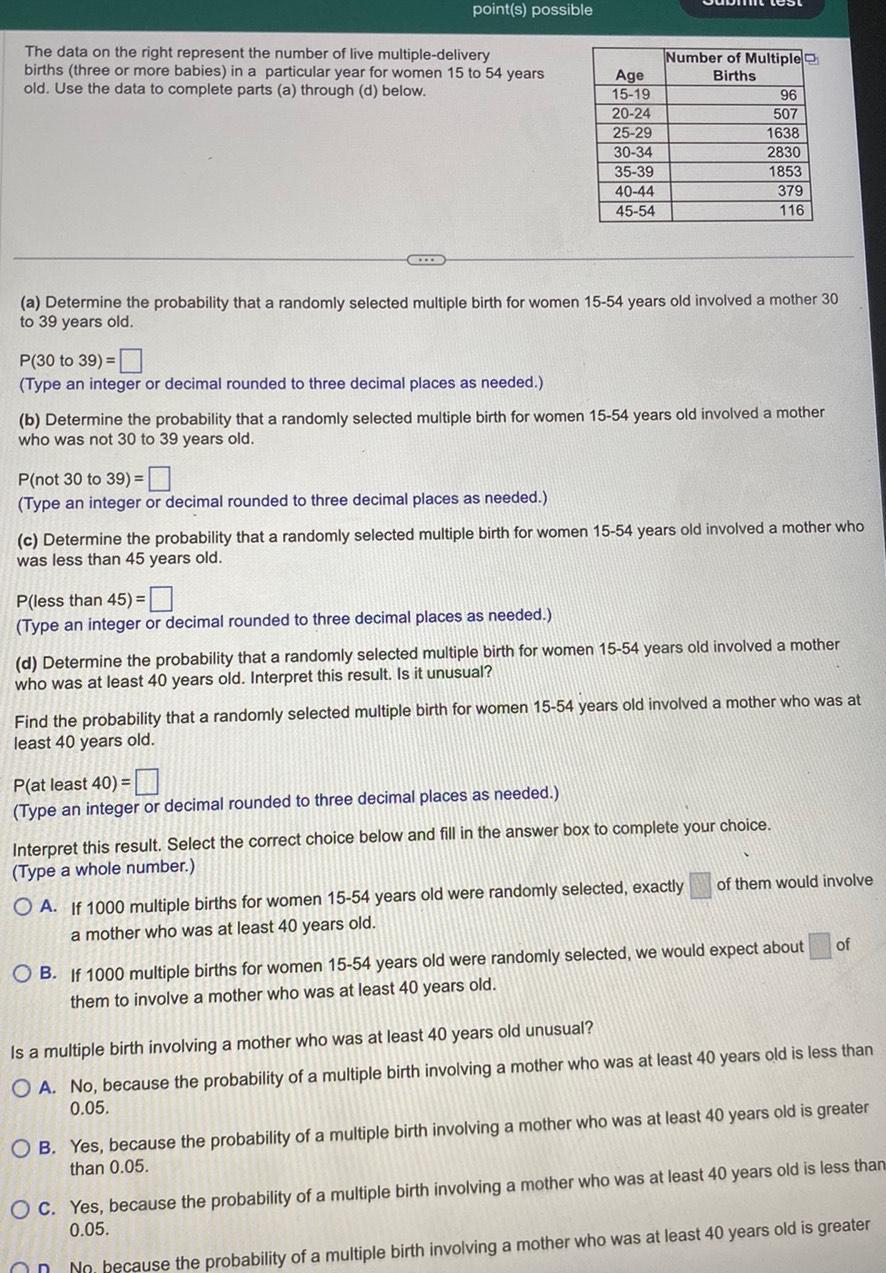
Statisticspoint s possible The data on the right represent the number of live multiple delivery births three or more babies in a particular year for women 15 to 54 years old Use the data to complete parts a through d below P 30 to 39 Type an integer or decimal rounded to three decimal places as needed P not 30 to 39 Type an integer or decimal rounded to three decimal places as needed a Determine the probability that a randomly selected multiple birth for women 15 54 years old involved a mother 30 to 39 years old Age 15 19 20 24 P less than 45 Type an integer or decimal rounded to three decimal places as needed 25 29 30 34 35 39 40 44 45 54 b Determine the probability that a randomly selected multiple birth for women 15 54 years old involved a mother who was not 30 to 39 years old Number of Multiple Births c Determine the probability that a randomly selected multiple birth for women 15 54 years old involved a mother who was less than 45 years old P at least 40 Type an integer or decimal rounded to three decimal places as needed 96 507 1638 2830 1853 379 116 d Determine the probability that a randomly selected multiple birth for women 15 54 years old involved a mother who was at least 40 years old Interpret this result Is it unusual Find the probability that a randomly selected multiple birth for women 15 54 years old involved a mother who was at least 40 years old Interpret this result Select the correct choice below and fill in the answer box to complete your choice Type a whole number OA If 1000 multiple births for women 15 54 years old were randomly selected exactly a mother who was at least 40 years old On of them would involve OB If 1000 multiple births for women 15 54 years old were randomly selected we would expect about them to involve a mother who was at least 40 years old of Is a multiple birth involving a mother who was at least 40 years old unusual OA No because the probability of a multiple birth involving a mother who was at least 40 years old is less than 0 05 OB Yes because the probability of a multiple birth involving a mother who was at least 40 years old is greater than 0 05 OC Yes because the probability of a multiple birth involving a mother who was at least 40 years old is less than 0 05 No because the probability of a multiple birth involving a mother who was at least 40 years old is greater
Statistics
StatisticsAccording to an almanac 60 of adult smokers started smoking before turning 18 years old a Compute the mean and standard deviation of the random variable X the number of smokers who started before 18 in 100 trials of the probability experiment b Interpret the mean c Would it be unusual to observe 90 smokers who started smoking before turning 18 years old in a random sample of 100 adult smokers Why a Hx x Round to the nearest tenth as needed b What is the correct interpretation of the mean OA It is expected that in a random sample of 100 adult smokers 60 will have started smoking before turning 18 OB It is expected that in 50 of random samples of 100 adult smokers 60 will have started smoking before turning 18 OC It is expected that in a random sample of 100 adult smokers 60 will have started smoking after turning 18 c Would it be unusual to observe 90 smokers who started smoking before turning 18 years old in a random sample of 100 adult smokers OA Yes because 90 is greater than 20 OB No because 90 is less than 20 OC No because 90 is between 20 and 20 OD Yes because 90 is between 20 and 20 OE No because 90 is greater than 20
Statistics
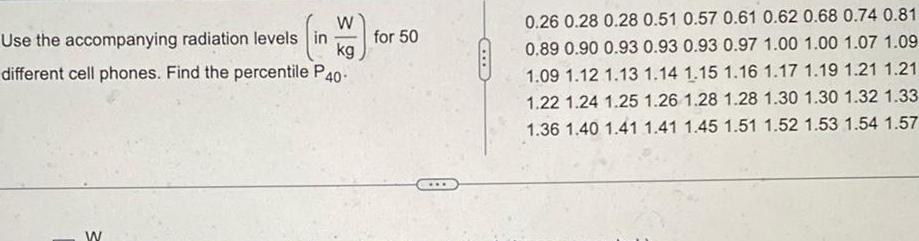
StatisticsW Use the accompanying radiation levels in kg different cell phones Find the percentile P40 W for 50 0 26 0 28 0 28 0 51 0 57 0 61 0 62 0 68 0 74 0 81 0 89 0 90 0 93 0 93 0 93 0 97 1 00 1 00 1 07 1 09 1 09 1 12 1 13 1 14 1 15 1 16 1 17 1 19 1 21 1 21 1 22 1 24 1 25 1 26 1 28 1 28 1 30 1 30 1 32 1 33 1 36 1 40 1 41 1 41 1 45 1 51 1 52 1 53 1 54 1 57
Statistics
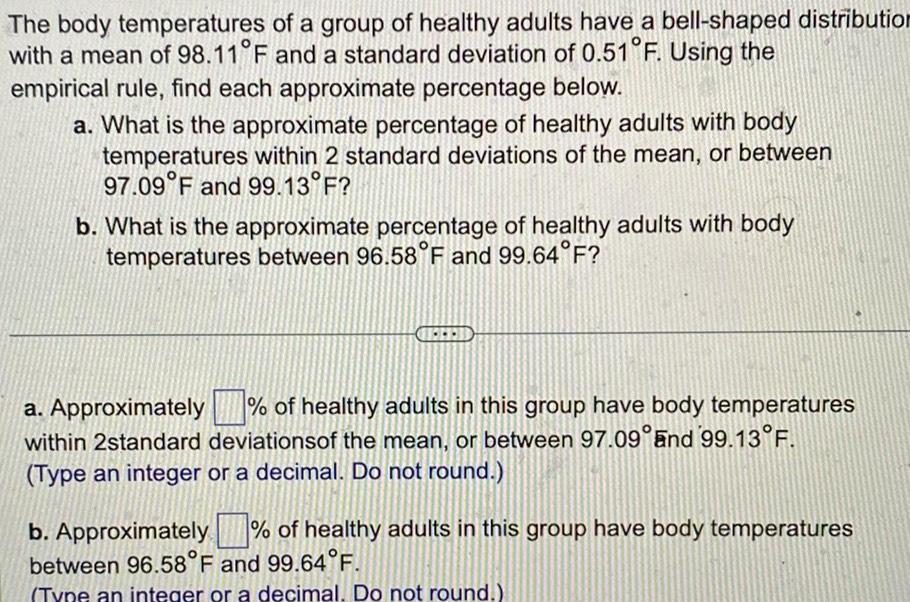
StatisticsThe body temperatures of a group of healthy adults have a bell shaped distribution with a mean of 98 11 F and a standard deviation of 0 51 F Using the empirical rule find each approximate percentage below a What is the approximate percentage of healthy adults with body temperatures within 2 standard deviations of the mean or between 97 09 F and 99 13 F b What is the approximate percentage of healthy adults with body temperatures between 96 58 F and 99 64 F a Approximately of healthy adults in this group have body temperatures within 2standard deviations of the mean or between 97 09 and 99 13 F Type an integer or a decimal Do not round b Approximately of healthy adults in this group have body temperatures between 96 58 F and 99 64 F Type an integer or a decimal Do not round
Statistics
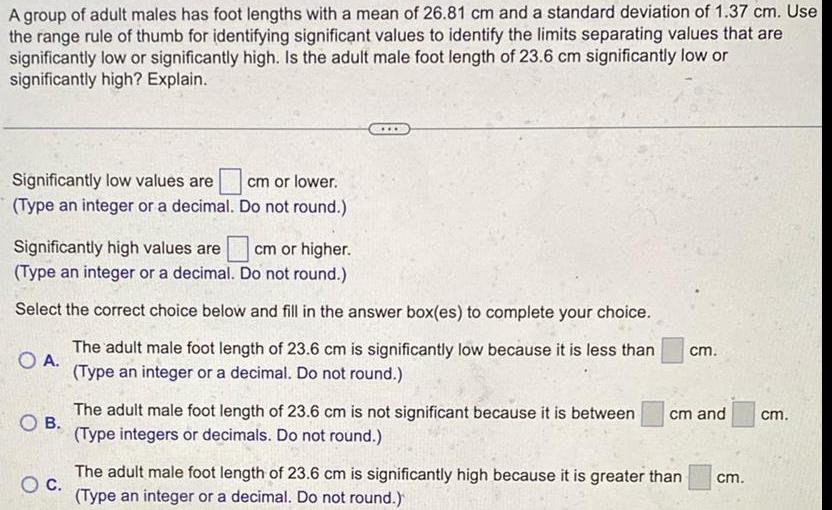
StatisticsA group of adult males has foot lengths with a mean of 26 81 cm and a standard deviation of 1 37 cm Use the range rule of thumb for identifying significant values to identify the limits separating values that are significantly low or significantly high Is the adult male foot length of 23 6 cm significantly low or significantly high Explain Significantly low values are Type an integer or a decimal cm or lower Do not round Significantly high values are cm or higher Type an integer or a decimal Do not round Select the correct choice below and fill in the answer box es to complete your choice O A The adult male foot length of 23 6 cm is significantly low because it is less than Type an integer or a decimal Do not round OB The adult male foot length of 23 6 cm is not significant because it is between Type integers or decimals Do not round cm cm and O C The adult male foot length of 23 6 cm is significantly high because it is greater than cm Type an integer or a decimal Do not round cm
Statistics
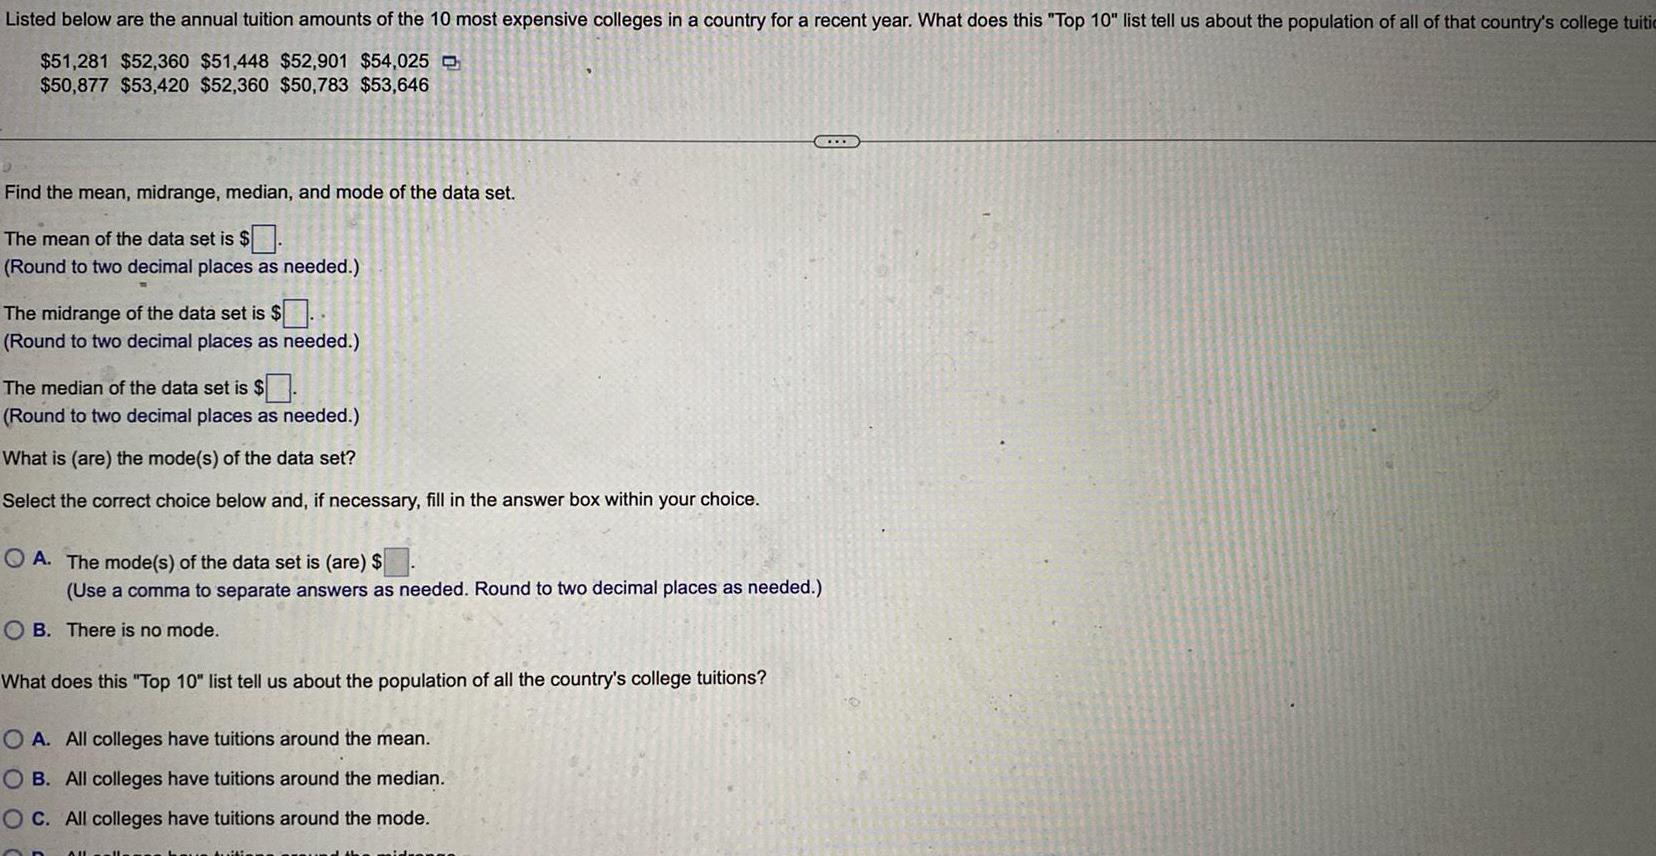
StatisticsListed below are the annual tuition amounts of the 10 most expensive colleges in a country for a recent year What does this Top 10 list tell us about the population of all of that country s college tuiti 51 281 52 360 51 448 52 901 54 025 50 877 53 420 52 360 50 783 53 646 Find the mean midrange median and mode of the data set The mean of the data set is Round to two decimal places as needed The midrange of the data set is Round to two decimal places as needed The median of the data set is Round to two decimal places as needed What is are the mode s of the data set Select the correct choice below and if necessary fill in the answer box within your choice OA The mode s of the data set is are Use a comma to separate answers as needed Round to two decimal places as needed OB There is no mode What does this Top 10 list tell us about the population of all the country s college tuitions O A All colleges have tuitions around the mean OB All colleges have tuitions around the median OC All colleges have tuitions around the mode C AU CO
Statistics
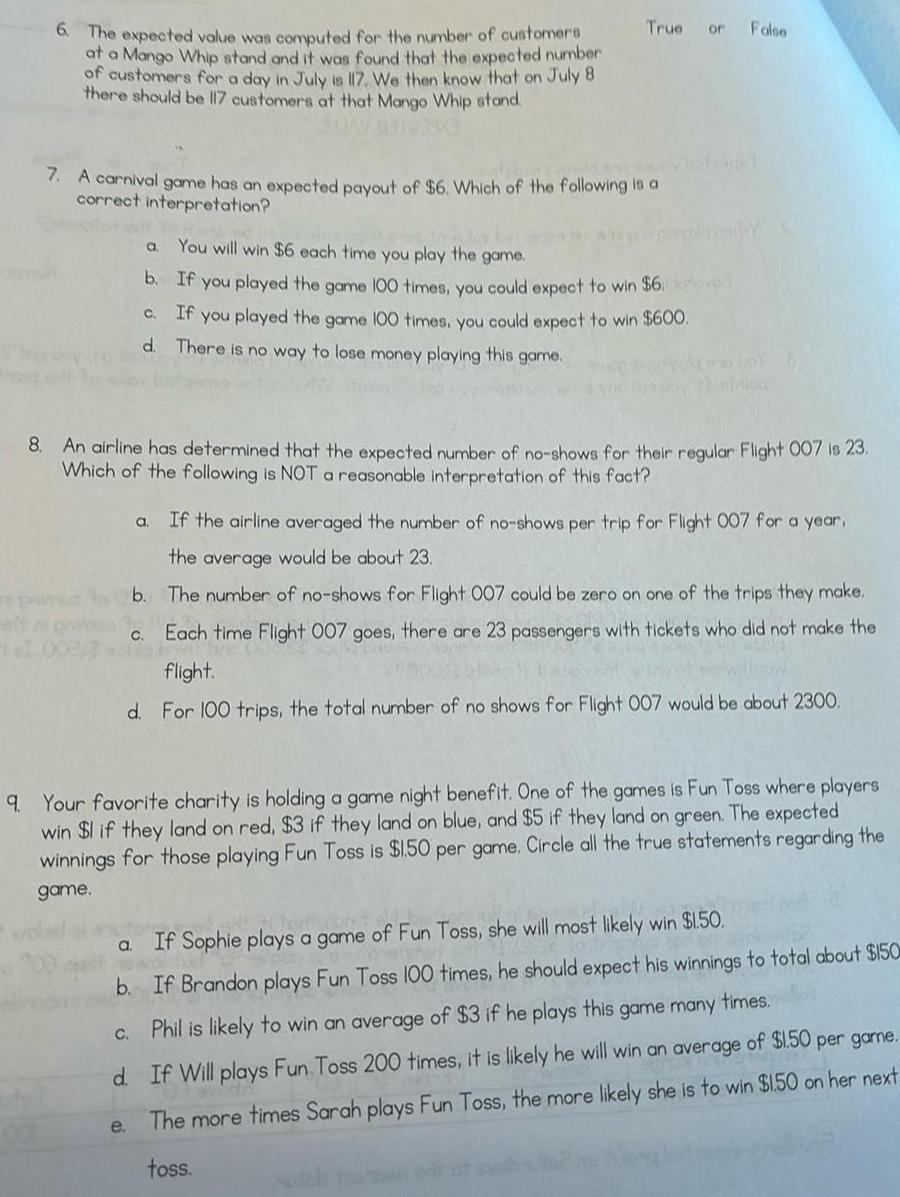
Statistics6 The expected value was computed for the number of customers at a Mango Whip stand and it was found that the expected number of customers for a day in July is 117 We then know that on July 8 there should be 117 customers at that Mango Whip stand ADAY GENTOT K 7 A carnival game has an expected payout of 6 Which of the following is a correct interpretation True or You will win 6 each time you play the game b If you played the game 100 times you could expect to win 6 C If you played the game 100 times you could expect to win 600 d There is no way to lose money playing this game 8 An airline has determined that the expected number of no shows for their regular Flight 007 is 23 Which of the following is NOT a reasonable interpretation of this fact a C a C e a If the airline averaged the number of no shows per trip for Flight 007 for a year the average would be about 23 b The number of no shows for Flight 007 could be zero on one of the trips they make Each time Flight 007 goes there are 23 passengers with tickets who did not make the flight d For 100 trips the total number of no shows for Flight 007 would be about 2300 False 9 Your favorite charity is holding a game night benefit One of the games is Fun Toss where players win 1 if they land on red 3 if they land on blue and 5 if they land on green The expected winnings for those playing Fun Toss is 1 50 per game Circle all the true statements regarding the game If Sophie plays a game of Fun Toss she will most likely win 1 50 b If Brandon plays Fun Toss 100 times he should expect his winnings to total about 150 Phil is likely to win an average of 3 if he plays this game many times d If Will plays Fun Toss 200 times it is likely he will win an average of 1 50 per game The more times Sarah plays Fun Toss the more likely she is to win 1 50 on her next toss
Statistics
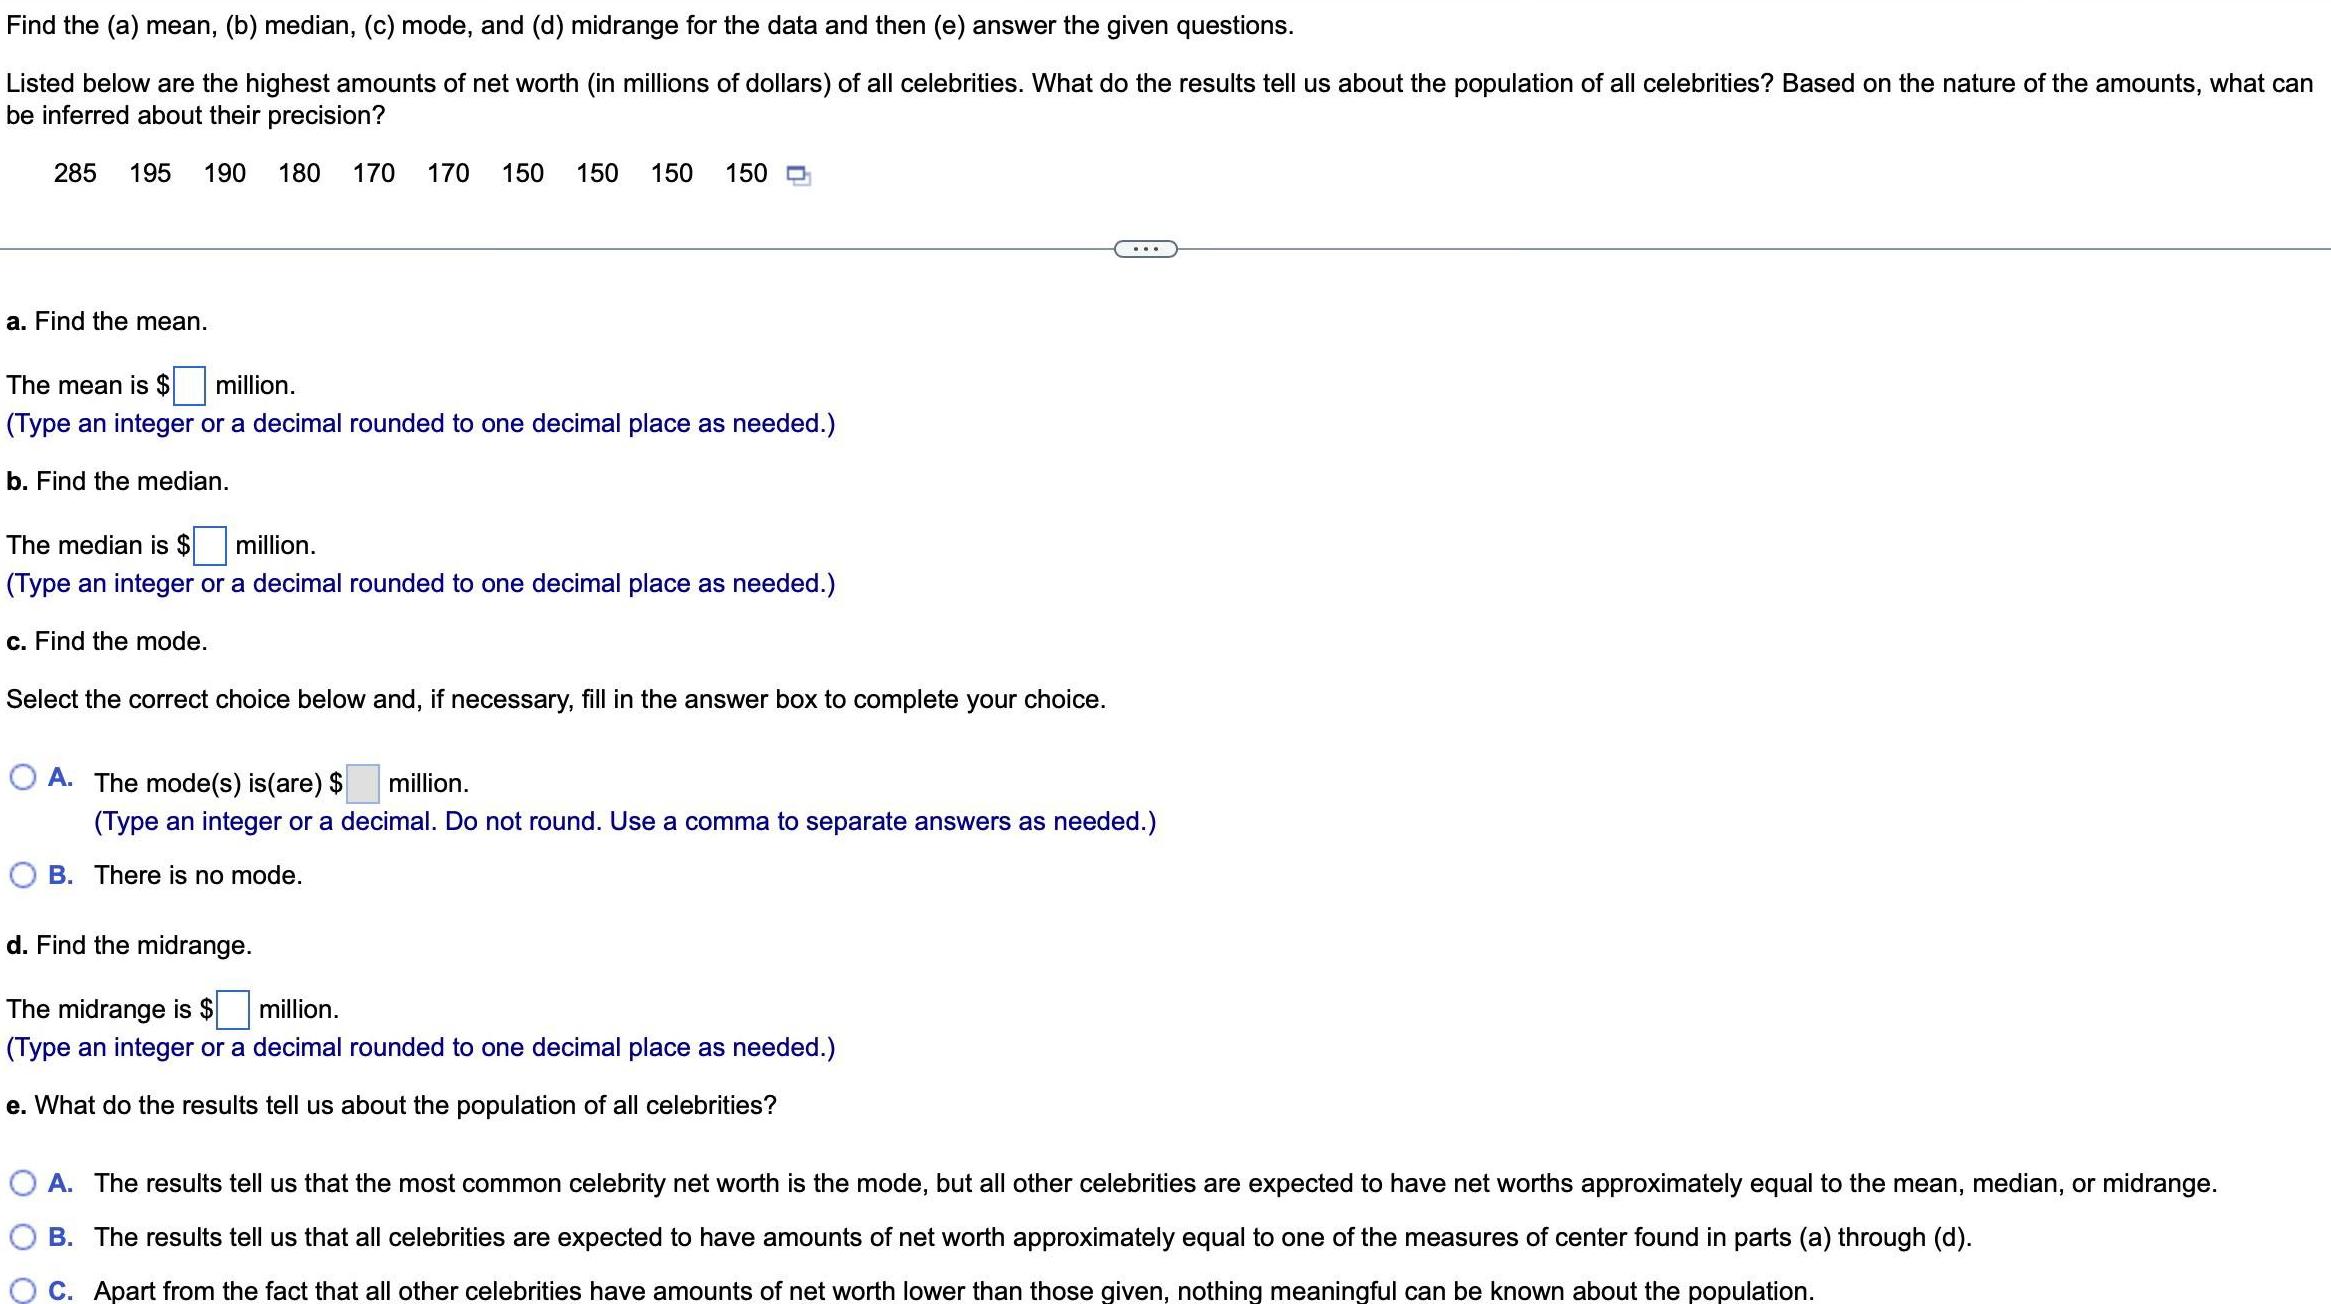
StatisticsFind the a mean b median c mode and d midrange for the data and then e answer the given questions Listed below are the highest amounts of net worth in millions of dollars of all celebrities What do the results tell us about the population of all celebrities Based on the nature of the amounts what can be inferred about their precision 285 195 190 180 a Find the mean 170 170 150 150 150 150 D The mean is million Type an integer or a decimal rounded to one decimal place as needed b Find the median The median is million Type an integer or a decimal rounded to one decimal place as needed c Find the mode Select the correct choice below and if necessary fill in the answer box to complete your choice OA The mode s is are million Type an integer or a decimal Do not round Use a comma to separate answers as needed B The is no mod d Find the midrange The midrange is million Type an integer or a decimal rounded to one decimal place as needed e What do the results tell us about the population of all celebrities O A The results tell us that the most common celebrity net worth is the mode but all other celebrities are expected to have net worths approximately equal to the mean median or midrange B The results tell us that all celebrities are expected to have amounts of net worth approximately equal to one of the measures of center found in parts a through d C Apart from the fact that all other celebrities have amounts of net worth lower than those given nothing meaningful can be known about the population
Statistics
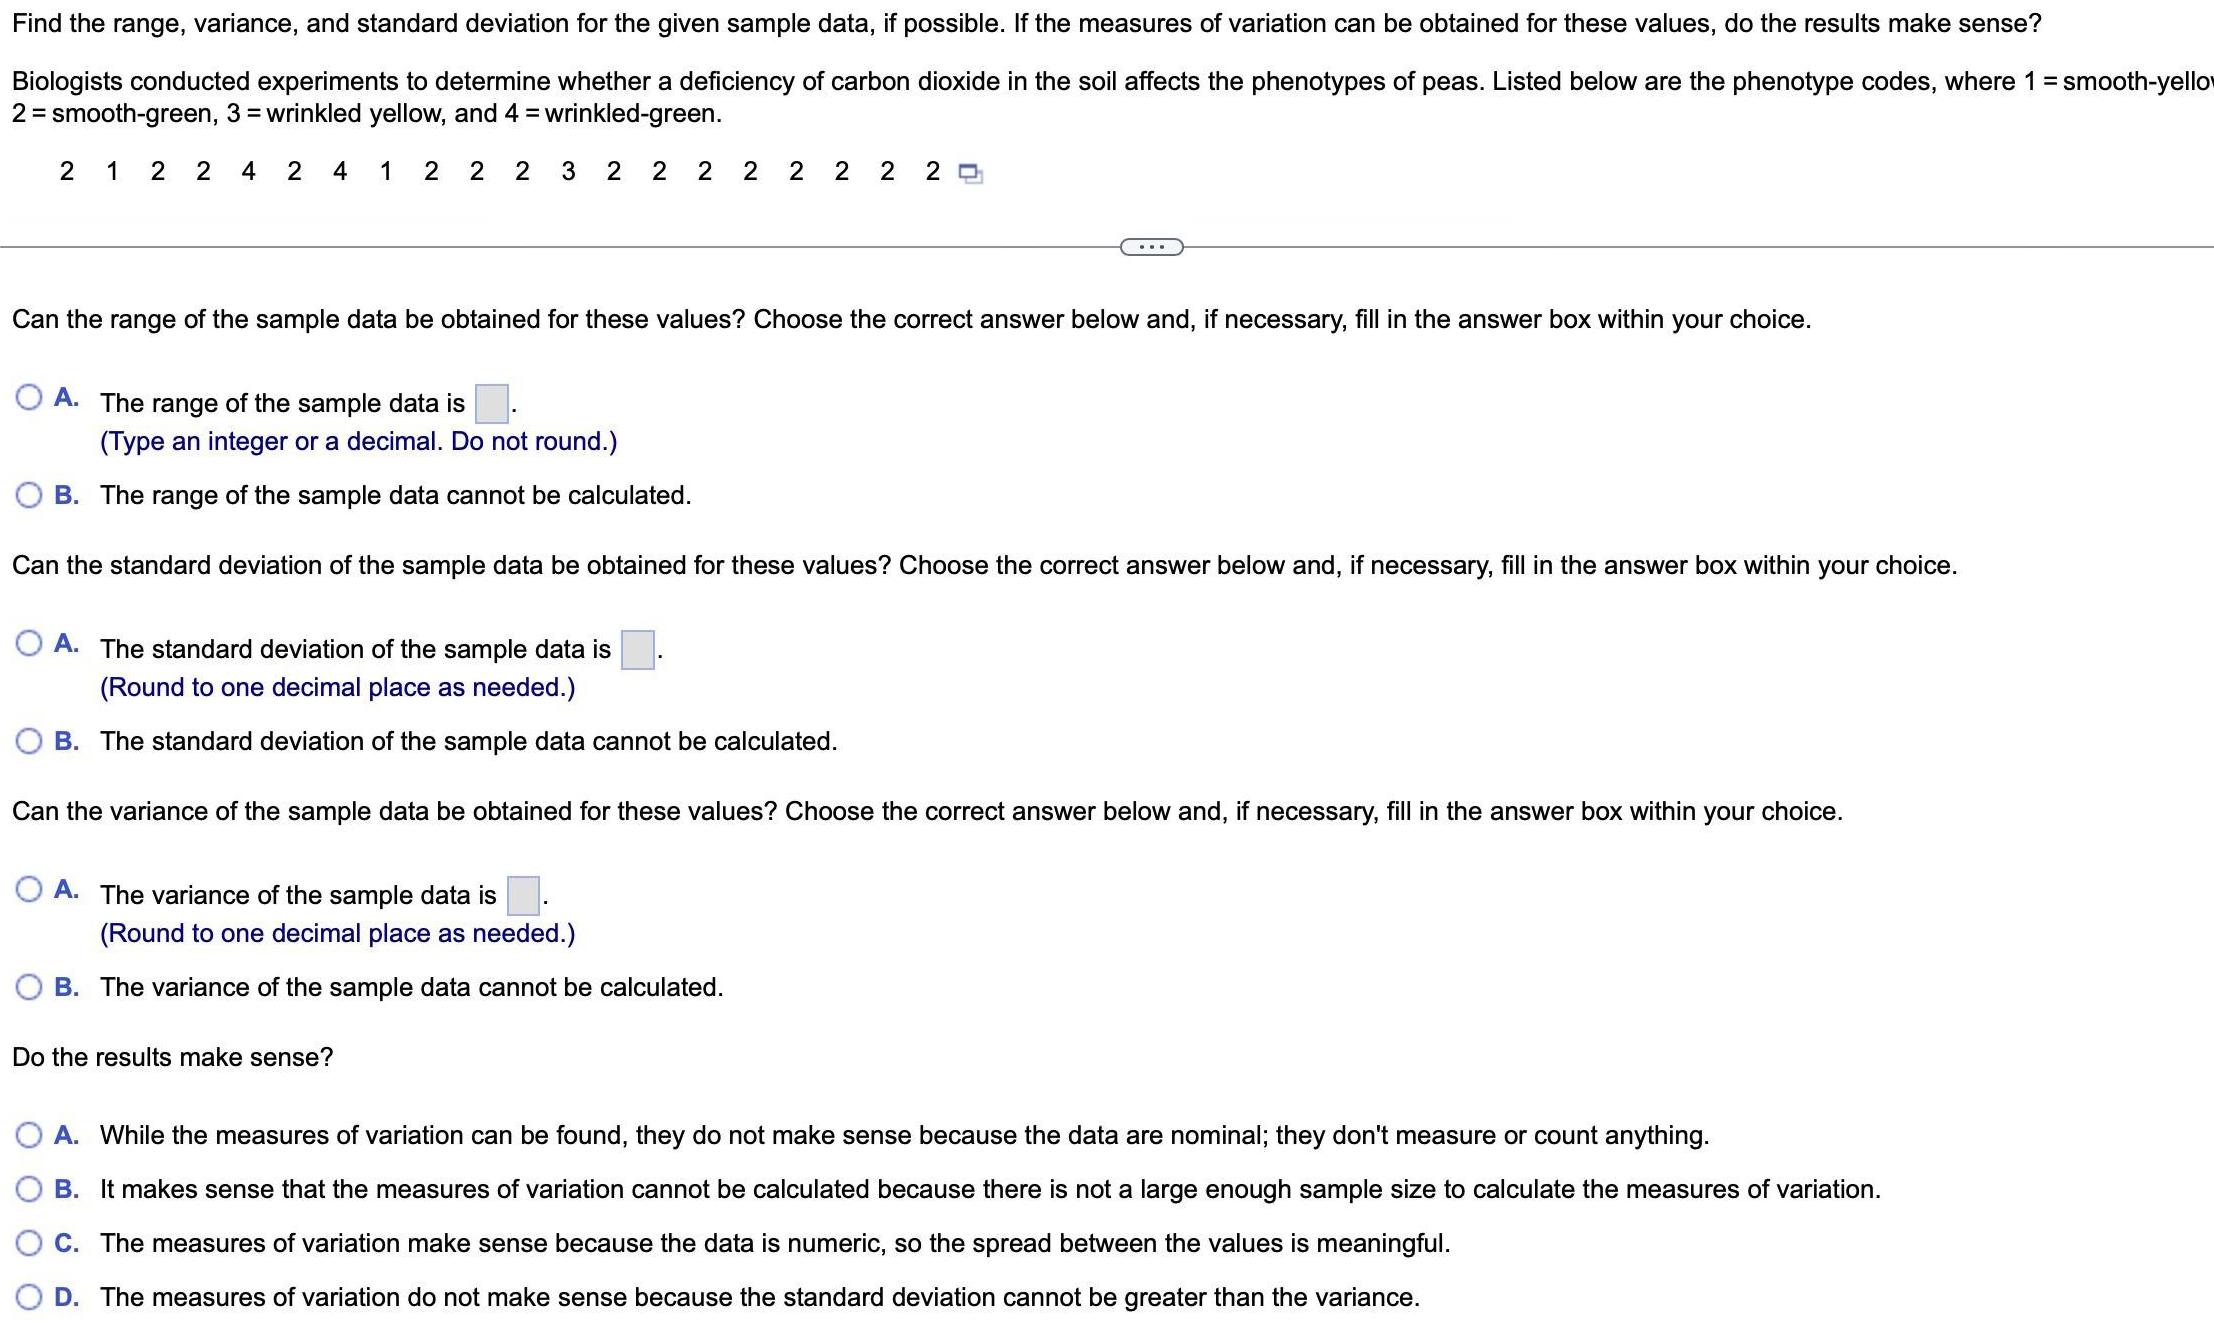
StatisticsFind the range variance and standard deviation for the given sample data if possible If the measures of variation can be obtained for these values do the results make sense Biologists conducted experiments to determine whether a deficiency of carbon dioxide in the soil affects the phenotypes of peas Listed below are the phenotype codes where 1 smooth yellow 2 smooth green 3 wrinkled yellow and 4 wrinkled green 21 2 24 2 4 1 22 2 3 2 2 2 2 2 2 2 20 Can the range of the sample data be obtained for these values Choose the correct answer below and if necessary fill in the answer box within your choice OA The range of the sample data is Type an integer or a decimal Do not round B The range of the sample data cannot be calculated Can the standard deviation of the sample data be obtained for these values Choose the correct answer below and if necessary fill in the answer box within your choice OA The standard deviation of the sample data is Round to one decimal place as needed B The standard deviation of the sample data cannot be calculated Can the variance of the sample data be obtained for these values Choose the correct answer below and if necessary fill in the answer box within your choice A The variance of the sample data is Round to one decimal place as needed B The variance of the sample data cannot be calculated Do the results make sense O A While the measures of variation can be found they do not make sense because the data are nominal they don t measure or count anything B It makes sense that the measures of variation cannot be calculated because there is not a large enough sample size to calculate the measures of variation C The measures of variation make sense because the data is numeric so the spread between the values is meaningful D The measures of variation do not make sense because the standard deviation cannot be greater than the variance
Statistics
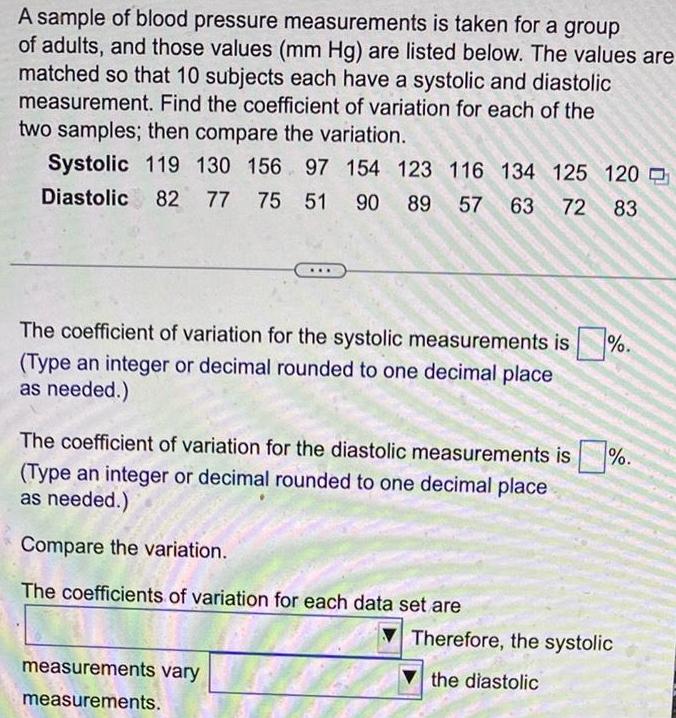
StatisticsA sample of blood pressure measurements is taken for a group of adults and those values mm Hg are listed below The values are matched so that 10 subjects each have a systolic and diastolic measurement Find the coefficient of variation for each of the two samples then compare the variation Systolic 119 130 156 97 154 123 116 134 125 120 Diastolic 82 77 75 51 90 89 57 63 72 83 The coefficient of variation for the systolic measurements is Type an integer or decimal rounded to one decimal place as needed The coefficient of variation for the diastolic measurements is Type an integer or decimal rounded to one decimal place as needed Compare the variation The coefficients of variation for each data set are measurements vary measurements Therefore the systolic the diastolic
Statistics
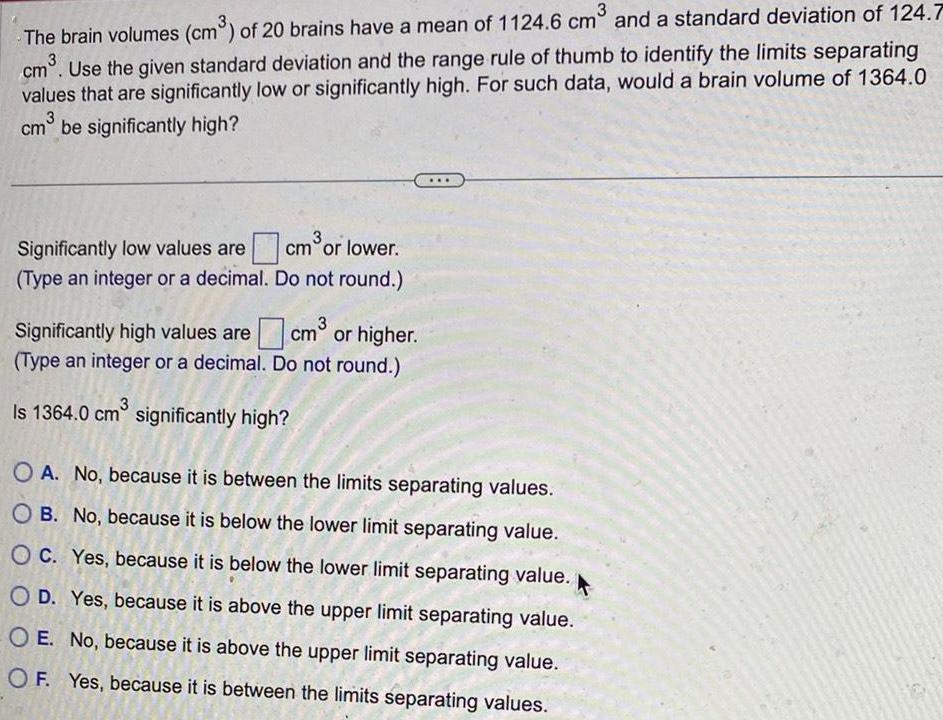
Statistics3 The brain volumes cm of 20 brains have a mean of 1124 6 cm and a standard deviation of 124 7 cm Use the given standard deviation and the range rule of thumb to identify the limits separating values that are significantly low or significantly high For such data would a brain volume of 1364 0 cm be significantly high Significantly low values are Type an integer or a decimal 3 cm or lower Do not round 3 cm or higher Do not round Significantly high values are Type an integer or a decimal Is 1364 0 cm significantly high O A No because it is between the limits separating values OB No because it is below the lower limit separating value OC Yes because it is below the lower limit separating value O D Yes because it is above the upper limit separating value OE No because it is above the upper limit separating value OF Yes because it is between the limits separating values
Statistics
StatisticsA group of adult males has foot lengths with a mean of 28 48 cm and a standard deviation of 1 36 cm Use the range rule of thumb for identifying significant values to identify the limits separating values that are significantly low or significantly high Is the adult male foot length of 31 5 cm significantly low or significantly high Explain Significantly low values are cm or lower Type an integer or a decimal Do not round Significantly high values are cm or higher Type an integer or a decimal Do not round Select the correct choice below and fill in the answer box es to complete your choice The adult male foot length of 31 5 cm is significantly OA low because it is less than cm Type an integer or a decimal Do not round The adult male foot length of 31 5 cm is not significant cm and B because it is between cm Type integers or decimals Do not round The adult male foot length of 31 5 cm is significantly cm Type an integer or a decimal Do not round O c high because it is greater than IS sh 9 4
Statistics
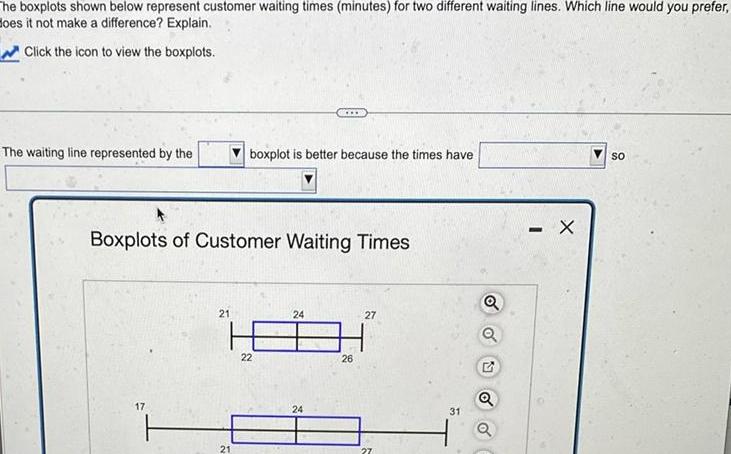
StatisticsThe boxplots shown below represent customer waiting times minutes for two different waiting lines Which line would you prefer does it not make a difference Explain Click the icon to view the boxplots The waiting line represented by the 17 Boxplots of Customer Waiting Times F 21 boxplot is better because the times have 21 24 18 22 www 24 26 27 27 31 Q Q Q Q X SO
Statistics
Statisticsdistribution of the time required to get an oil change at a 10 minute oil change facility is unknown However records indicate that the mean time is 10 5 minutes and the standard deviation is 4 minutes a To compute probabilities regarding the sample mean using the normal model what size sample would be required O Any sample size could be used O The sample size needs to be greater than 30 O The normal model cannot be used if the shape of the distribution is unknown O The sample size needs to be less than 30 b The probability that a random sample of n 46 oil changes results in a sample mean time less than 10 minutes is approximately Round to 4 decimal places c Suppose the manager agrees to pay each employee a 50 bonus if they meet a certain goal On a typical Saturday the oil change facility will perform 45 oil changes between 10 A M and 12 P M Treating this as a random sample at what mean oil change time would there be a 11 chance of being at or below This will be the goal established by the manager There would be a 11 chance of being at or below nearest 1 decimal place minutes Round to the
Statistics
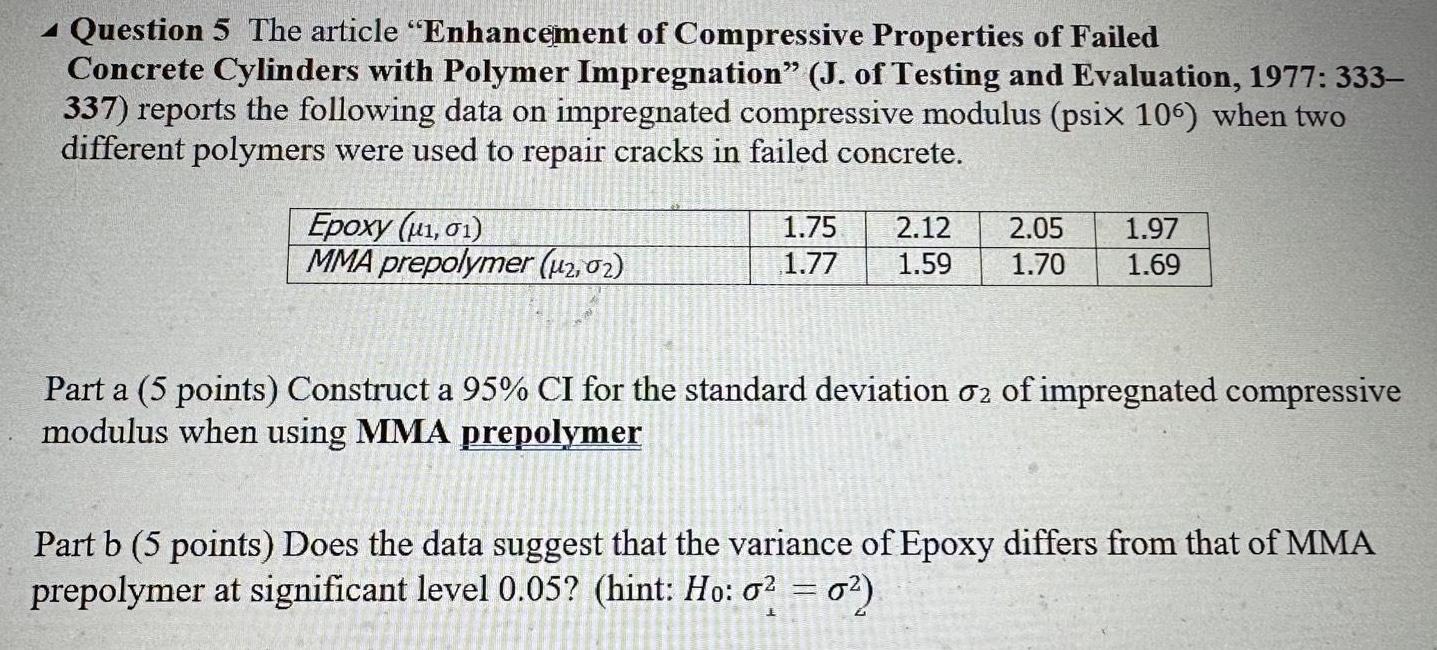
StatisticsQuestion 5 The article Enhancement of Compressive Properties of Failed Concrete Cylinders with Polymer Impregnation J of Testing and Evaluation 1977 333 337 reports the following data on impregnated compressive modulus psix 106 when two different polymers were used to repair cracks in failed concrete Epoxy 1 01 MMA prepolymer 2 02 1 75 2 12 2 05 1 77 1 59 1 70 1 97 1 69 Part a 5 points Construct a 95 CI for the standard deviation 02 of impregnated compressive modulus when using MMA prepolymer Part b 5 points Does the data suggest that the variance of Epoxy differs from that of MMA prepolymer at significant level 0 05 hint Ho 0 0
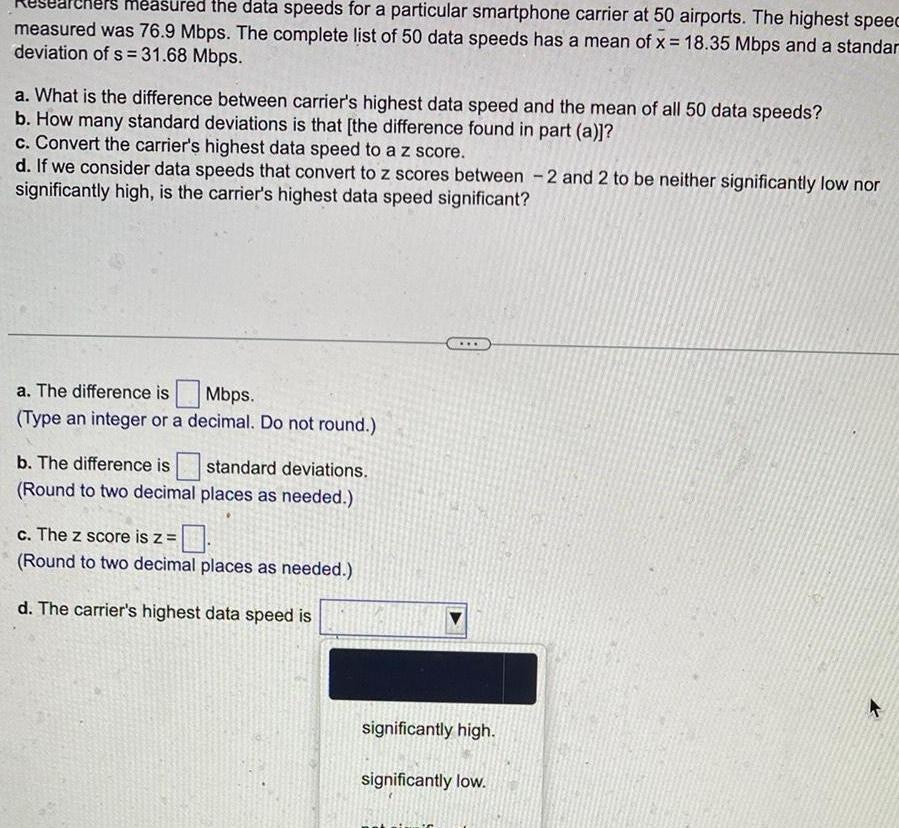
Statistics
Statisticsmeasured the data speeds for a particular smartphone carrier at 50 airports The highest speec measured was 76 9 Mbps The complete list of 50 data speeds has a mean of x 18 35 Mbps and a standar deviation of s 31 68 Mbps a What is the difference between carrier s highest data speed and the mean of all 50 data speeds b How many standard deviations is that the difference found in part a c Convert the carrier s highest data speed to a z score d If we consider data speeds that convert to z scores between 2 and 2 to be neither significantly low nor significantly high is the carrier s highest data speed significant a The difference is Mbps Type an integer or a decimal Do not round b The difference is standard deviations Round to two decimal places as needed c The z score is z Round to two decimal places as needed d The carrier s highest data speed is significantly high significantly low
Statistics
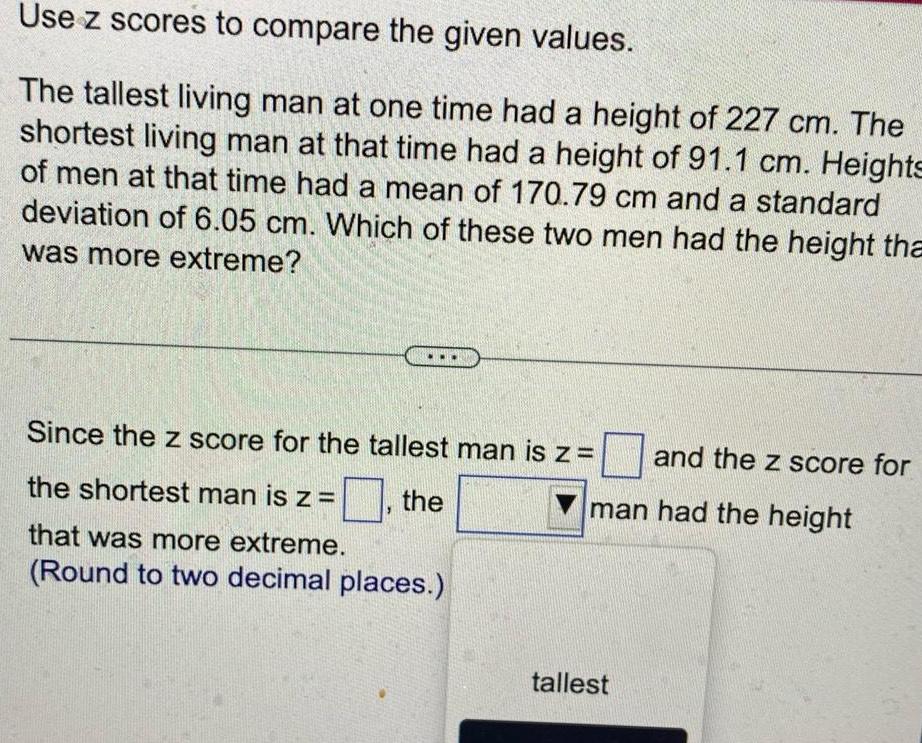
StatisticsUse z scores to compare the given values The tallest living man at one time had a height of 227 cm The shortest living man at that time had a height of 91 1 cm Heights of men at that time had a mean of 170 79 cm and a standard deviation of 6 05 cm Which of these two men had the height tha was more extreme Since the z score for the tallest man is z the shortest man is z the that was more extreme Round to two decimal places and the z score for man had the height tallest
Statistics
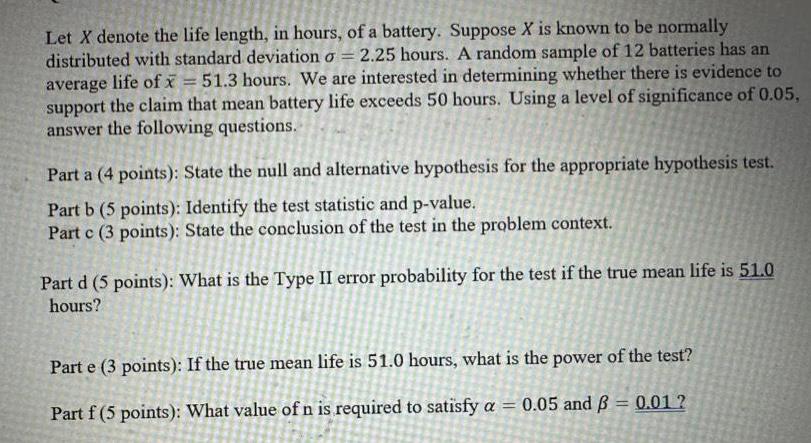
StatisticsLet X denote the life length in hours of a battery Suppose X is known to be normally distributed with standard deviation o 2 25 hours A random sample of 12 batteries has an average life of x 51 3 hours We are interested in determining whether there is evidence to support the claim that mean battery life exceeds 50 hours Using a level of significance of 0 05 answer the following questions Part a 4 points State the null and alternative hypothesis for the appropriate hypothesis test Part b 5 points Identify the test statistic and p value Part c 3 points State the conclusion of the test in the problem context Part d 5 points What is the Type II error probability for the test if the true mean life is 51 0 hours Part e 3 points If the true mean life is 51 0 hours what is the power of the test Part f 5 points What value of n is required to satisfy a 0 05 and 0 01
Statistics
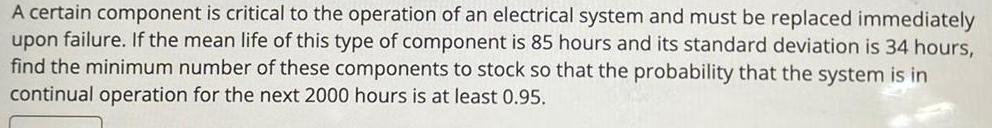
StatisticsA certain component is critical to the operation of an electrical system and must be replaced immediately upon failure If the mean life of this type of component is 85 hours and its standard deviation is 34 hours find the minimum number of these components to stock so that the probability that the system is in continual operation for the next 2000 hours is at least 0 95
Statistics
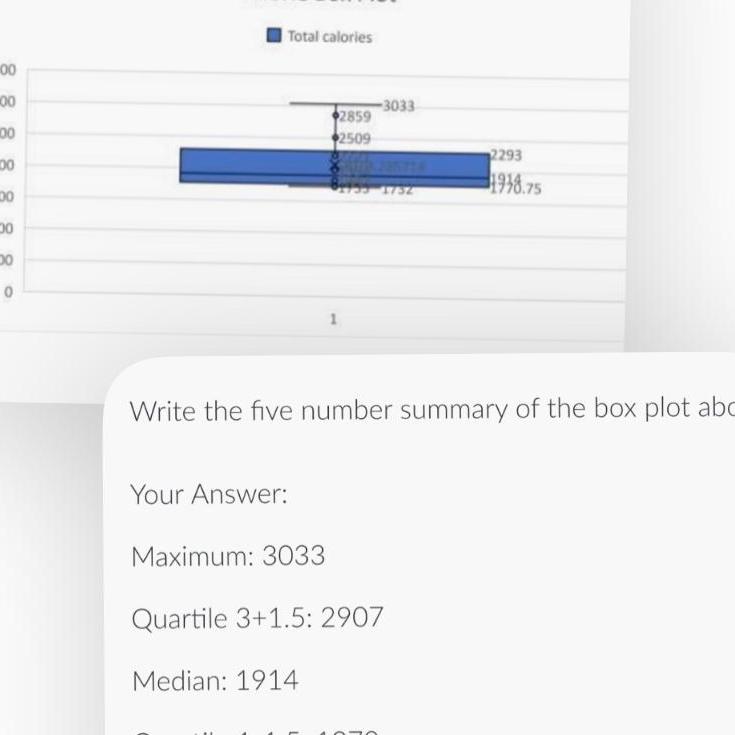
Statistics00 888 00 00 00 30 0 Total calories Your Answer 2859 2509 Median 1914 3033 81733 1732 1 Write the five number summary of the box plot abc Maximum 3033 Quartile 3 1 5 2907 2293 1938 75

Statistics
Statisticsthe cost of capital Is there a cost of retained earnings Explain briefly conceptually Chapter 10 Name two advant
Statistics
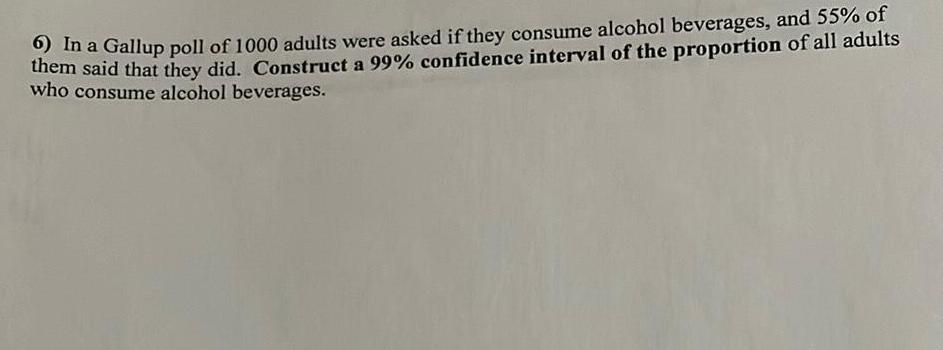
Statistics6 In a Gallup poll of 1000 adults were asked if they consume alcohol beverages and 55 of them said that they did Construct a 99 confidence interval of the proportion of all adults who consume alcohol beverages
Statistics
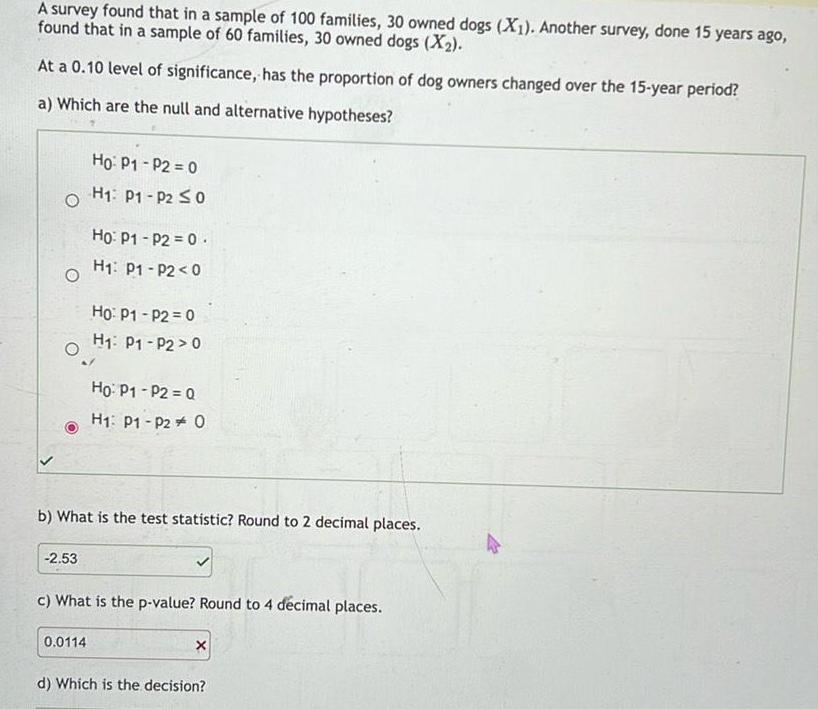
StatisticsA survey found that in a sample of 100 families 30 owned dogs X1 Another survey done 15 years ago found that in a sample of 60 families 30 owned dogs X At a 0 10 level of significance has the proportion of dog owners changed over the 15 year period a Which are the null and alternative hypotheses O O 2 53 Ho P1 P2 0 H P1 P2 0 Ho P1 P2 0 H P1 P2 0 0 0114 Ho P1 P2 0 H P1 P2 0 b What is the test statistic Round to 2 decimal places Ho P1 P2 Q H1 P1 P2 O c What is the p value Round to 4 d cimal places X d Which is the decision
Statistics
StatisticsA sample of 40 earthquake depths has a mean of 8 km Use a 0 01 significance level to test the claim of a seismologist that these earthquakes are from a population that has a mean depth less than 10 km Assume that the population standard deviation is known to be 4 km Ho Ha Test Statistics P value Decision
Statistics
Statistics5 The overhead reach distances of adult females are normally distributed with a mean of 220 cm and a standard deviation of 4 cm a Find the probability that an individual distance is greater than 230 cm b Find the probability that the mean for 25 randomly selected distances is greater than 230 cm
Statistics
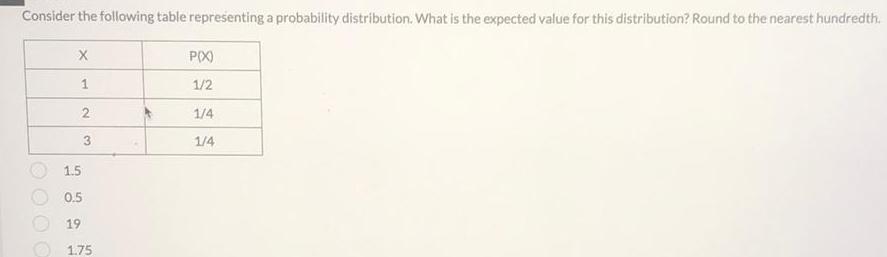
StatisticsConsider the following table representing a probability distribution What is the expected value for this distribution Round to the nearest hundredth X 1 2 3 1 5 0 5 19 1 75 P X 1 2 1 4 1 4
Statistics
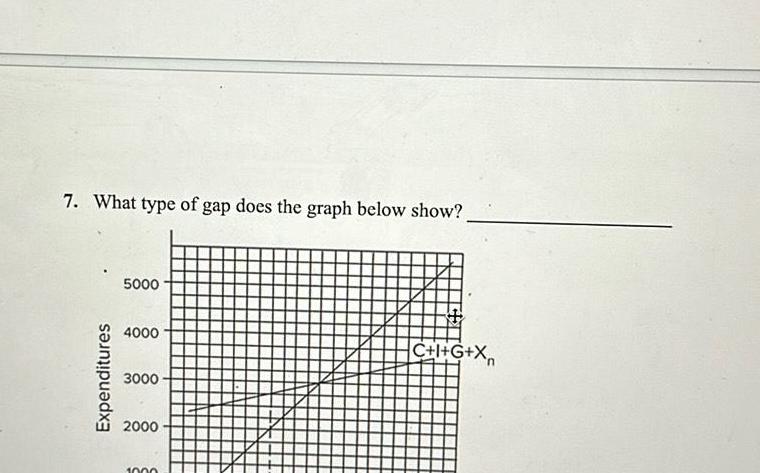
Statistics7 What type of gap does the graph below show Expenditures 5000 4000 3000 2000 1000 C I G X
Statistics
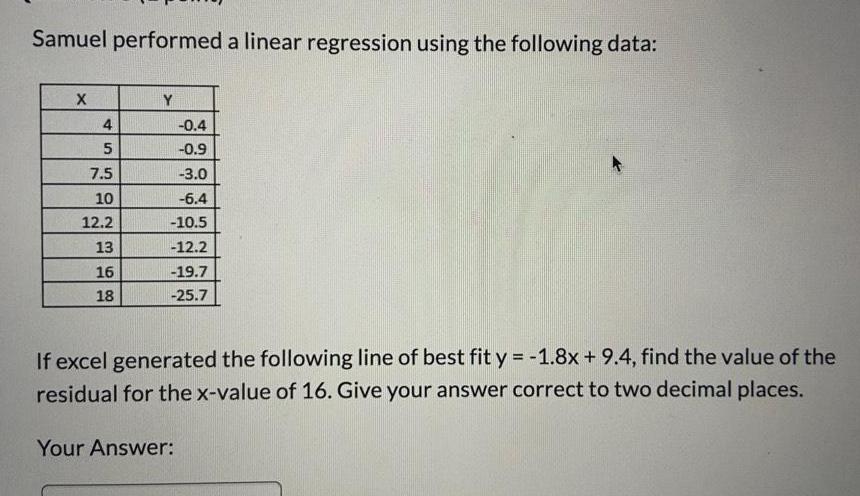
StatisticsSamuel performed a linear regression using the following data X 4 5 7 5 10 12 2 13 16 18 Y 0 4 0 9 3 0 6 4 10 5 12 2 19 7 25 7 If excel generated the following line of best fit y 1 8x 9 4 find the value of the residual for the x value of 16 Give your answer correct to two decimal places Your Answer

Statistics
StatisticsWhat is the definition of biological evolution Check your answer in Section 1 O Population changes due to natural selection O Mutation due to norm of reaction O A change in allele frequencies in a population over time Change in an organism over its life span

Statistics
StatisticsA 0 5 3 Il y a eu 15 donneurs ce matin une clinique de la Soci t canadienne du sang Voici la distribution de leur groupe sanguin Groupe sanguin OA BAB 8 3 3 de donneurs 1 Nous s lectionnons au hasard deux donneurs sans remise parmi ces 15 donneurs Quelle est la probabilit que nous s lectionnions exactement un donneur du groupe O

Statistics
Statistics2 La couleur des yeux d un membre d un groupe de 1770 hommes allemands est soit bleu ou brun et la couleur des cheveux est soit blond ou brun Dans ce groupe il y a 320 hommes qui ont les cheveux bruns et les yeux bruns et il y a 250 hommes qui ont les cheveux bruns et les yeux bleus En outre 400 ont les cheveux blonds et les yeux bruns Quelle est la probabilit qu un membre choisi au hasard de ce groupe a les cheveux blonds et les yeux bleus

Statistics
Statisticsesc 12 AKS 30 The graph of the function h x 2 x 1 is shown below List the characteristics of h x bing left X118 int Right X 3 Domain x 18 ya Positive Decreasing X intercept s 1 0 a How long will it take for the rocket to return to the ground d What is the maximum height Range 0 13 If a toy rocket is launched vertically upward from ground level with an initial velocity of 128 feet per second then its height h after t seconds is given by the equations h t 16t 128t if air resistance is neglected c How long will it take the rocket to hit its maximum height x18 y Negative Increasing o Y intercept s 0 2 x y b After how many seconds will the rocket be 112 feet above the ground

Statistics
StatisticsUnit 3 10 AKS 3a Simplify the following expression and then rewrite with radical form 12 ny n Power to Power 5 5n 1 Expoent must be Positive multiplay exporcent X 12 22 9 AKS 4e Use the graph find the solution s 2 Multiplay add exponentes 8 2 5 x X y 3 11 AKS 3 Simplify the following expression Same base Divide Subtract exponent 3 343 6 4 y 83 25 X x 1 6 12 13 S n6 5 Power Root 2 y s Kadical form x5 Vys Power root